
Beeswarm chart
beeswarm test

Photo of the Month
Monthly curation of engaging photojournalism work from the Arkansas Democrat-Gazette.
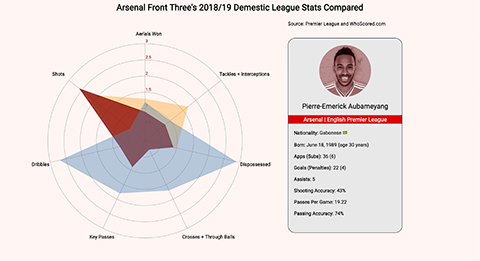
Arsenal Front Three's 2018/19 League Stats Compared
An interactive radar chart comparing Arsenal front three's domestic league performances from the 2018/19 season.

Interactive Mobile Photography Essay
A scrollytelling presentation of personal mobile photography work. Designed and produced with fullPage.js.
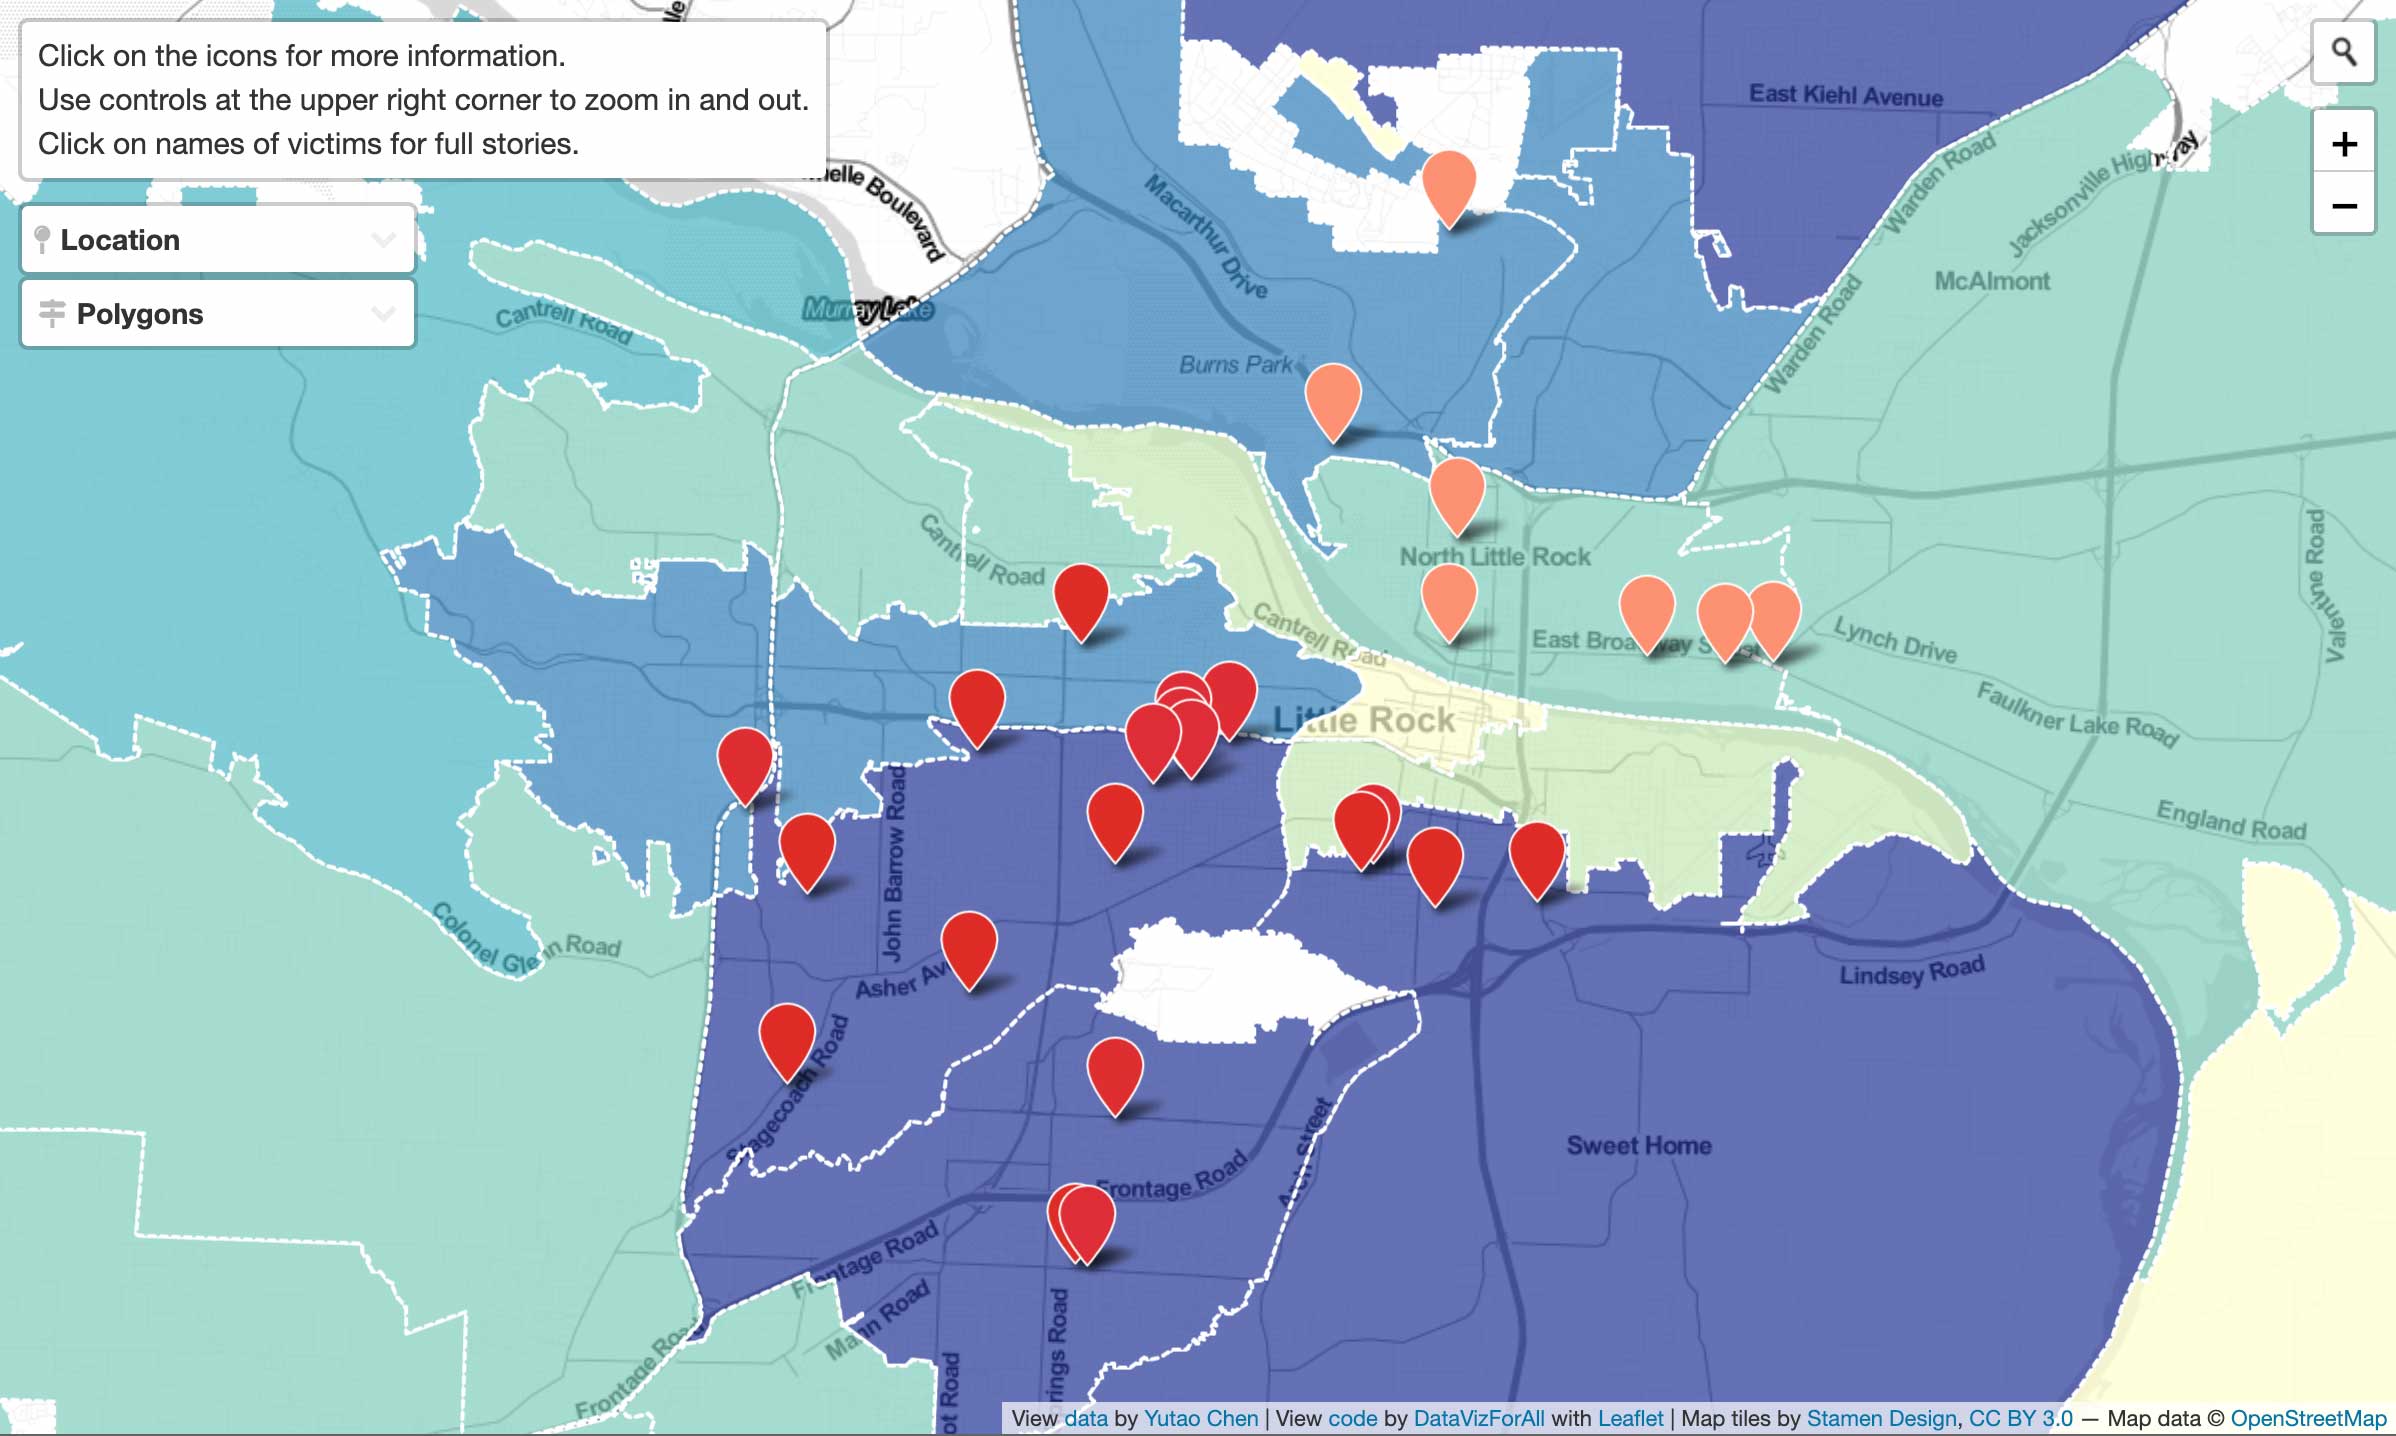
Little Rock/North Little Rock Homicides
A leaflet map showing homicides in Little Rock and North Little Rock, AR in 2019. Point data and settings documented on linked Google Sheets.
Dirty Business
A collaborative multimedia project on plastic recycling in Minh Khai, Vietnam where recyclers wrestle with the blessings and curses of an empire built on our trash.
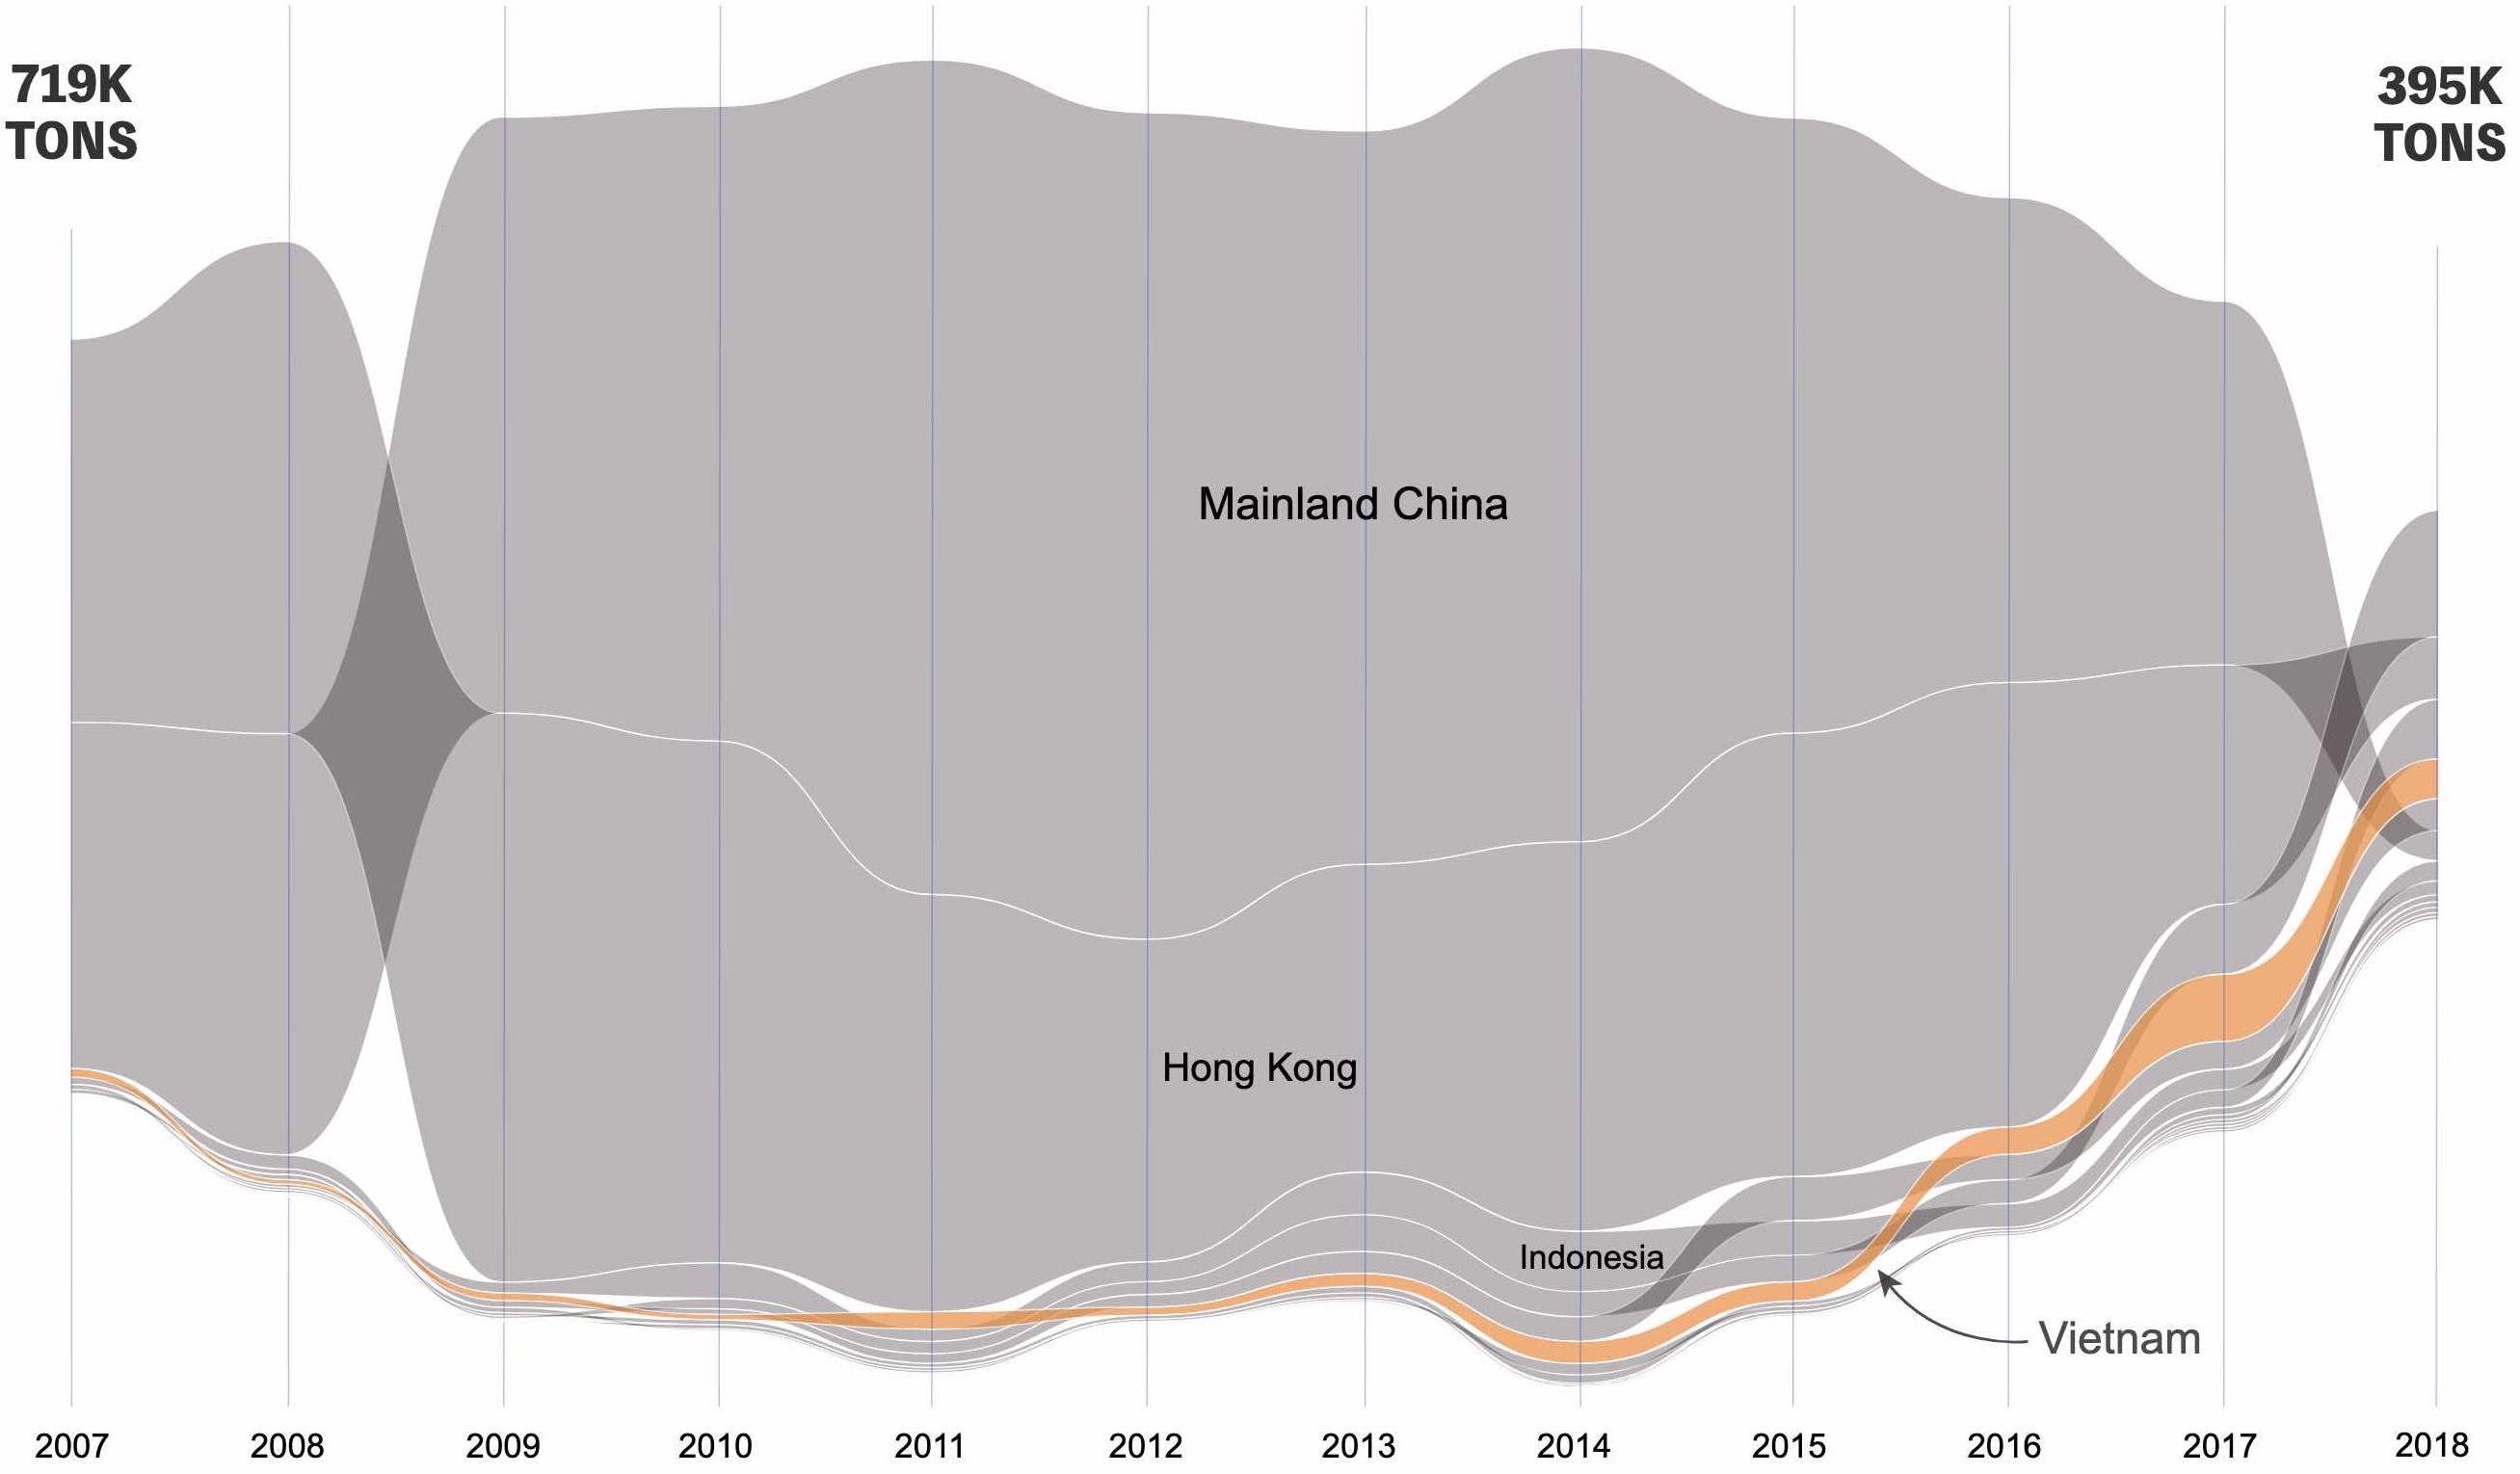
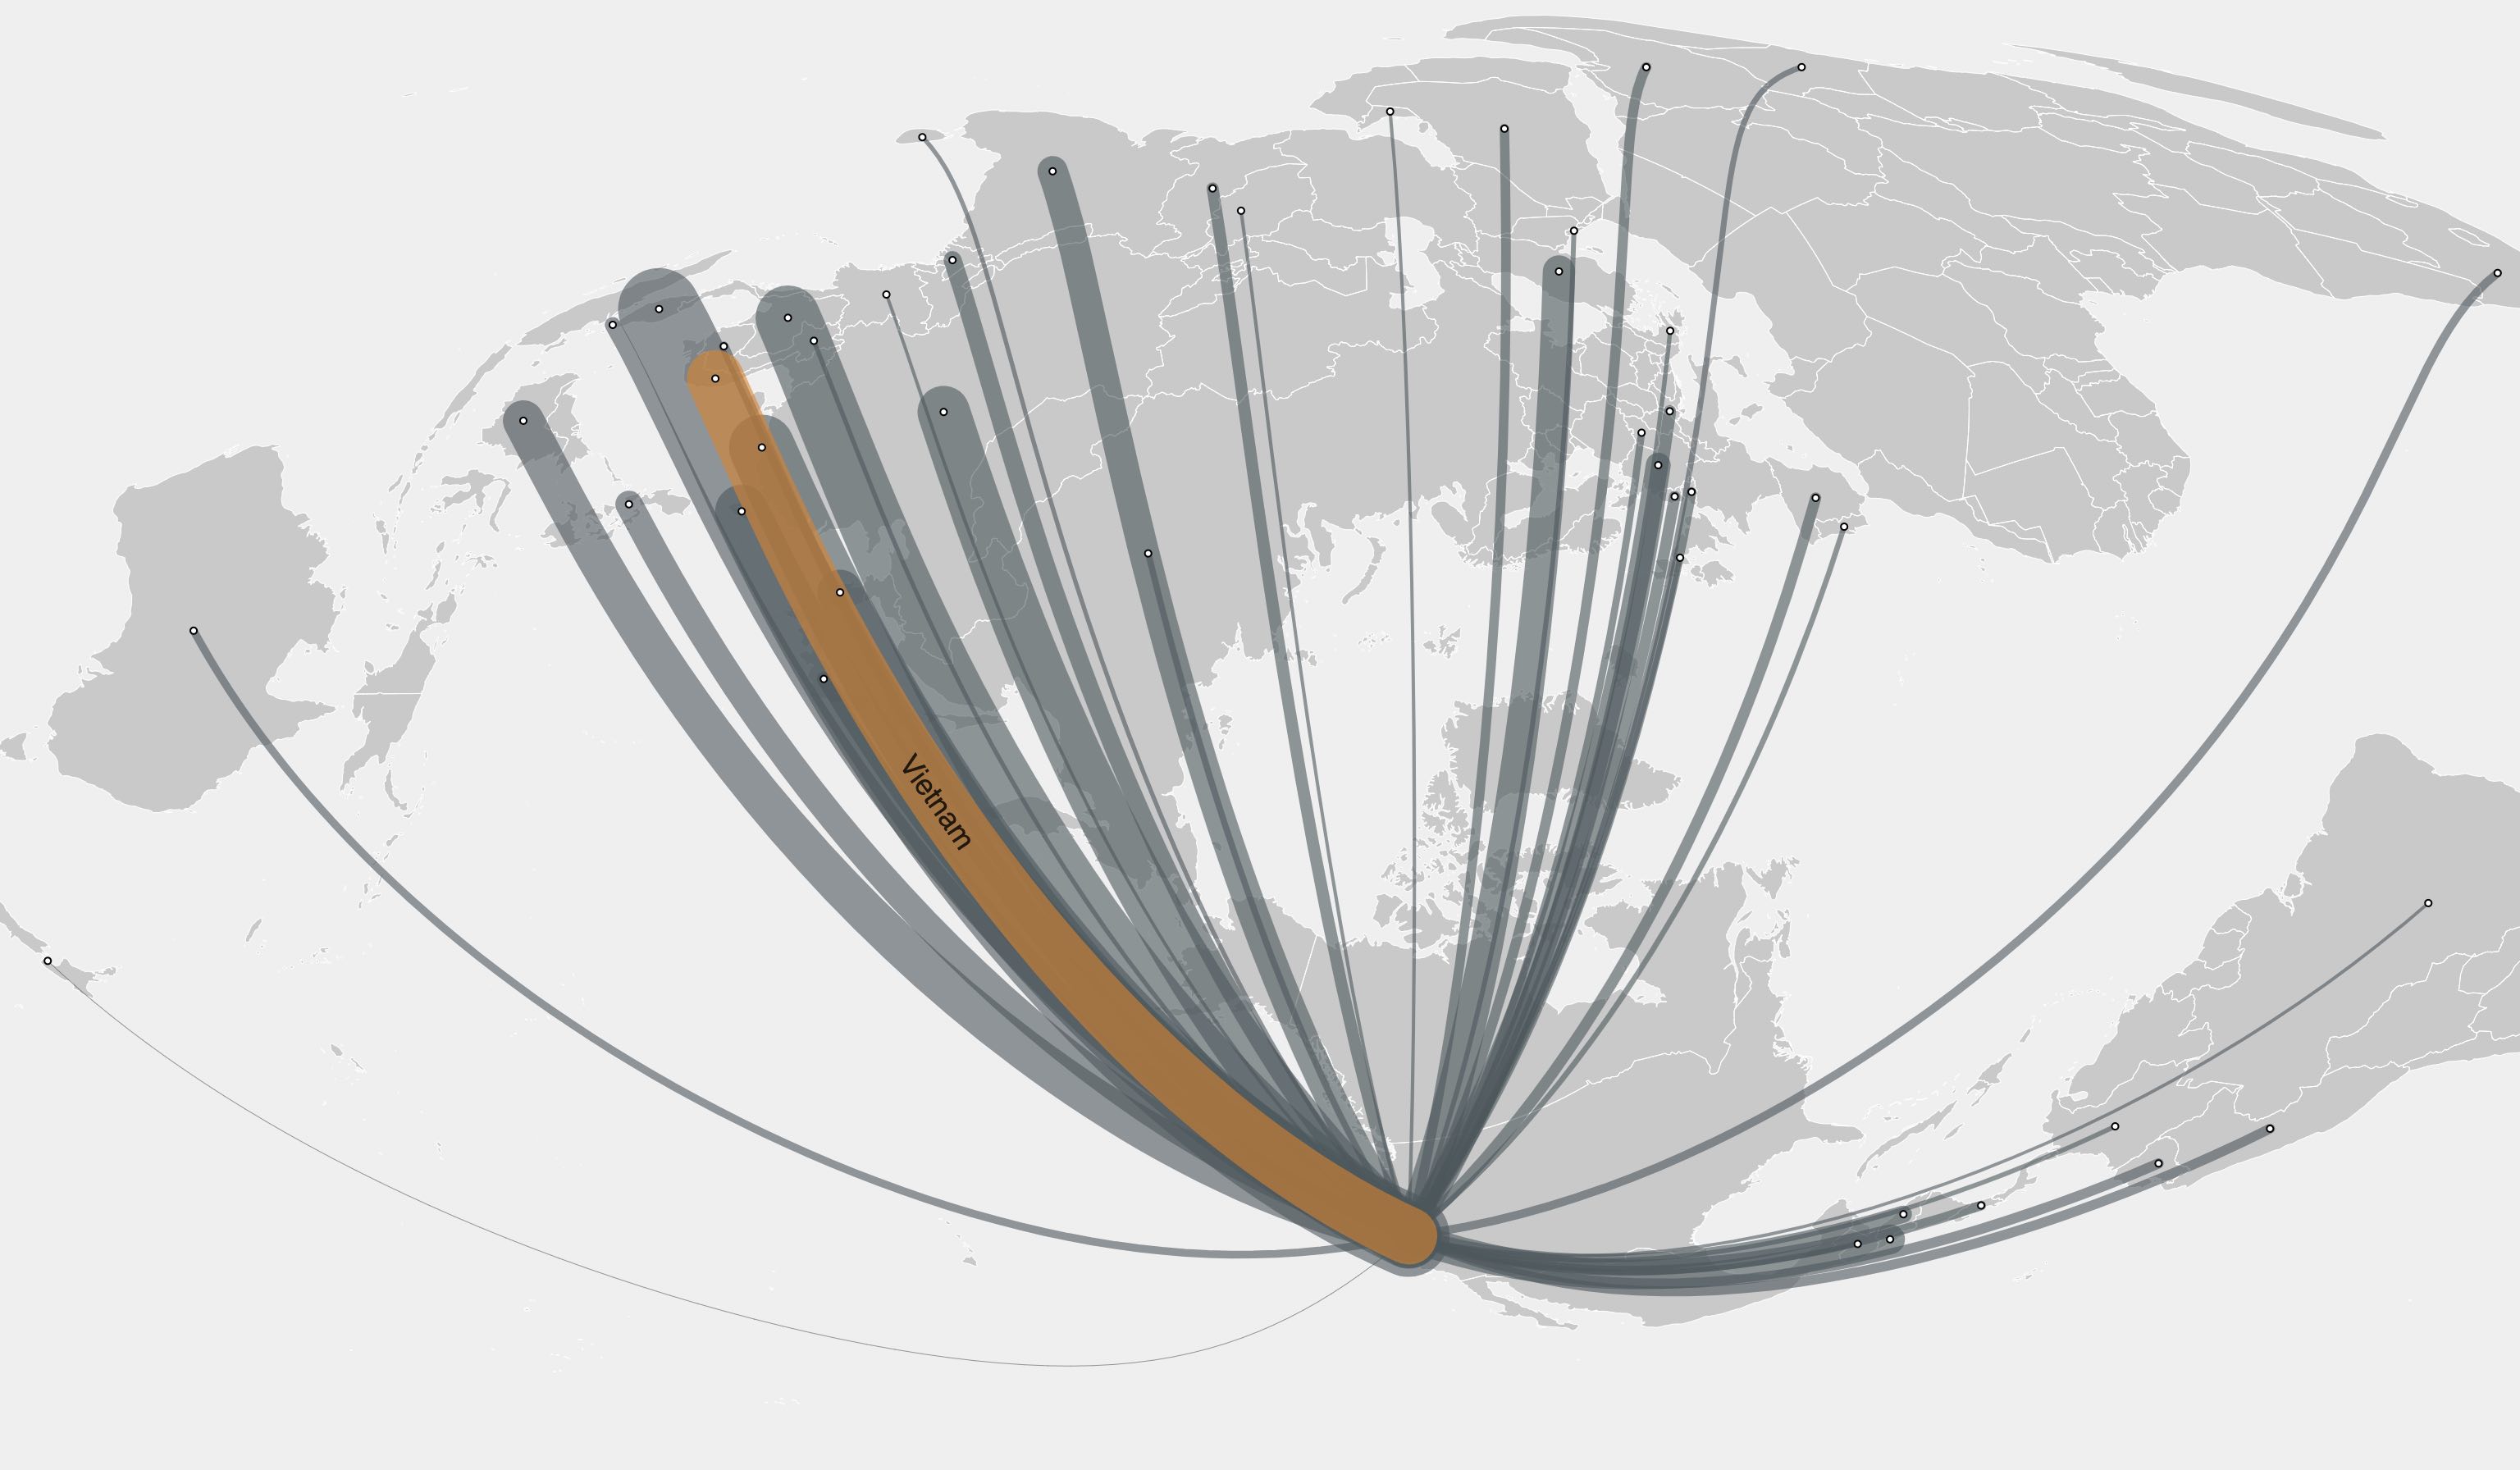
Golden State's Exports of Plastic Waste I
A variable-thickness band chart tracking California's recyclable plastic scrap exports since 2007. Part of a multimedia project documenting plastic recycling in Vietnam.
Golden State's Exports of Plastic Waste II
An interactive map illustrasting California's recyclable plastic exports by region in 2018. Part of a multimedia project documenting plastic recycling in Vietnam.
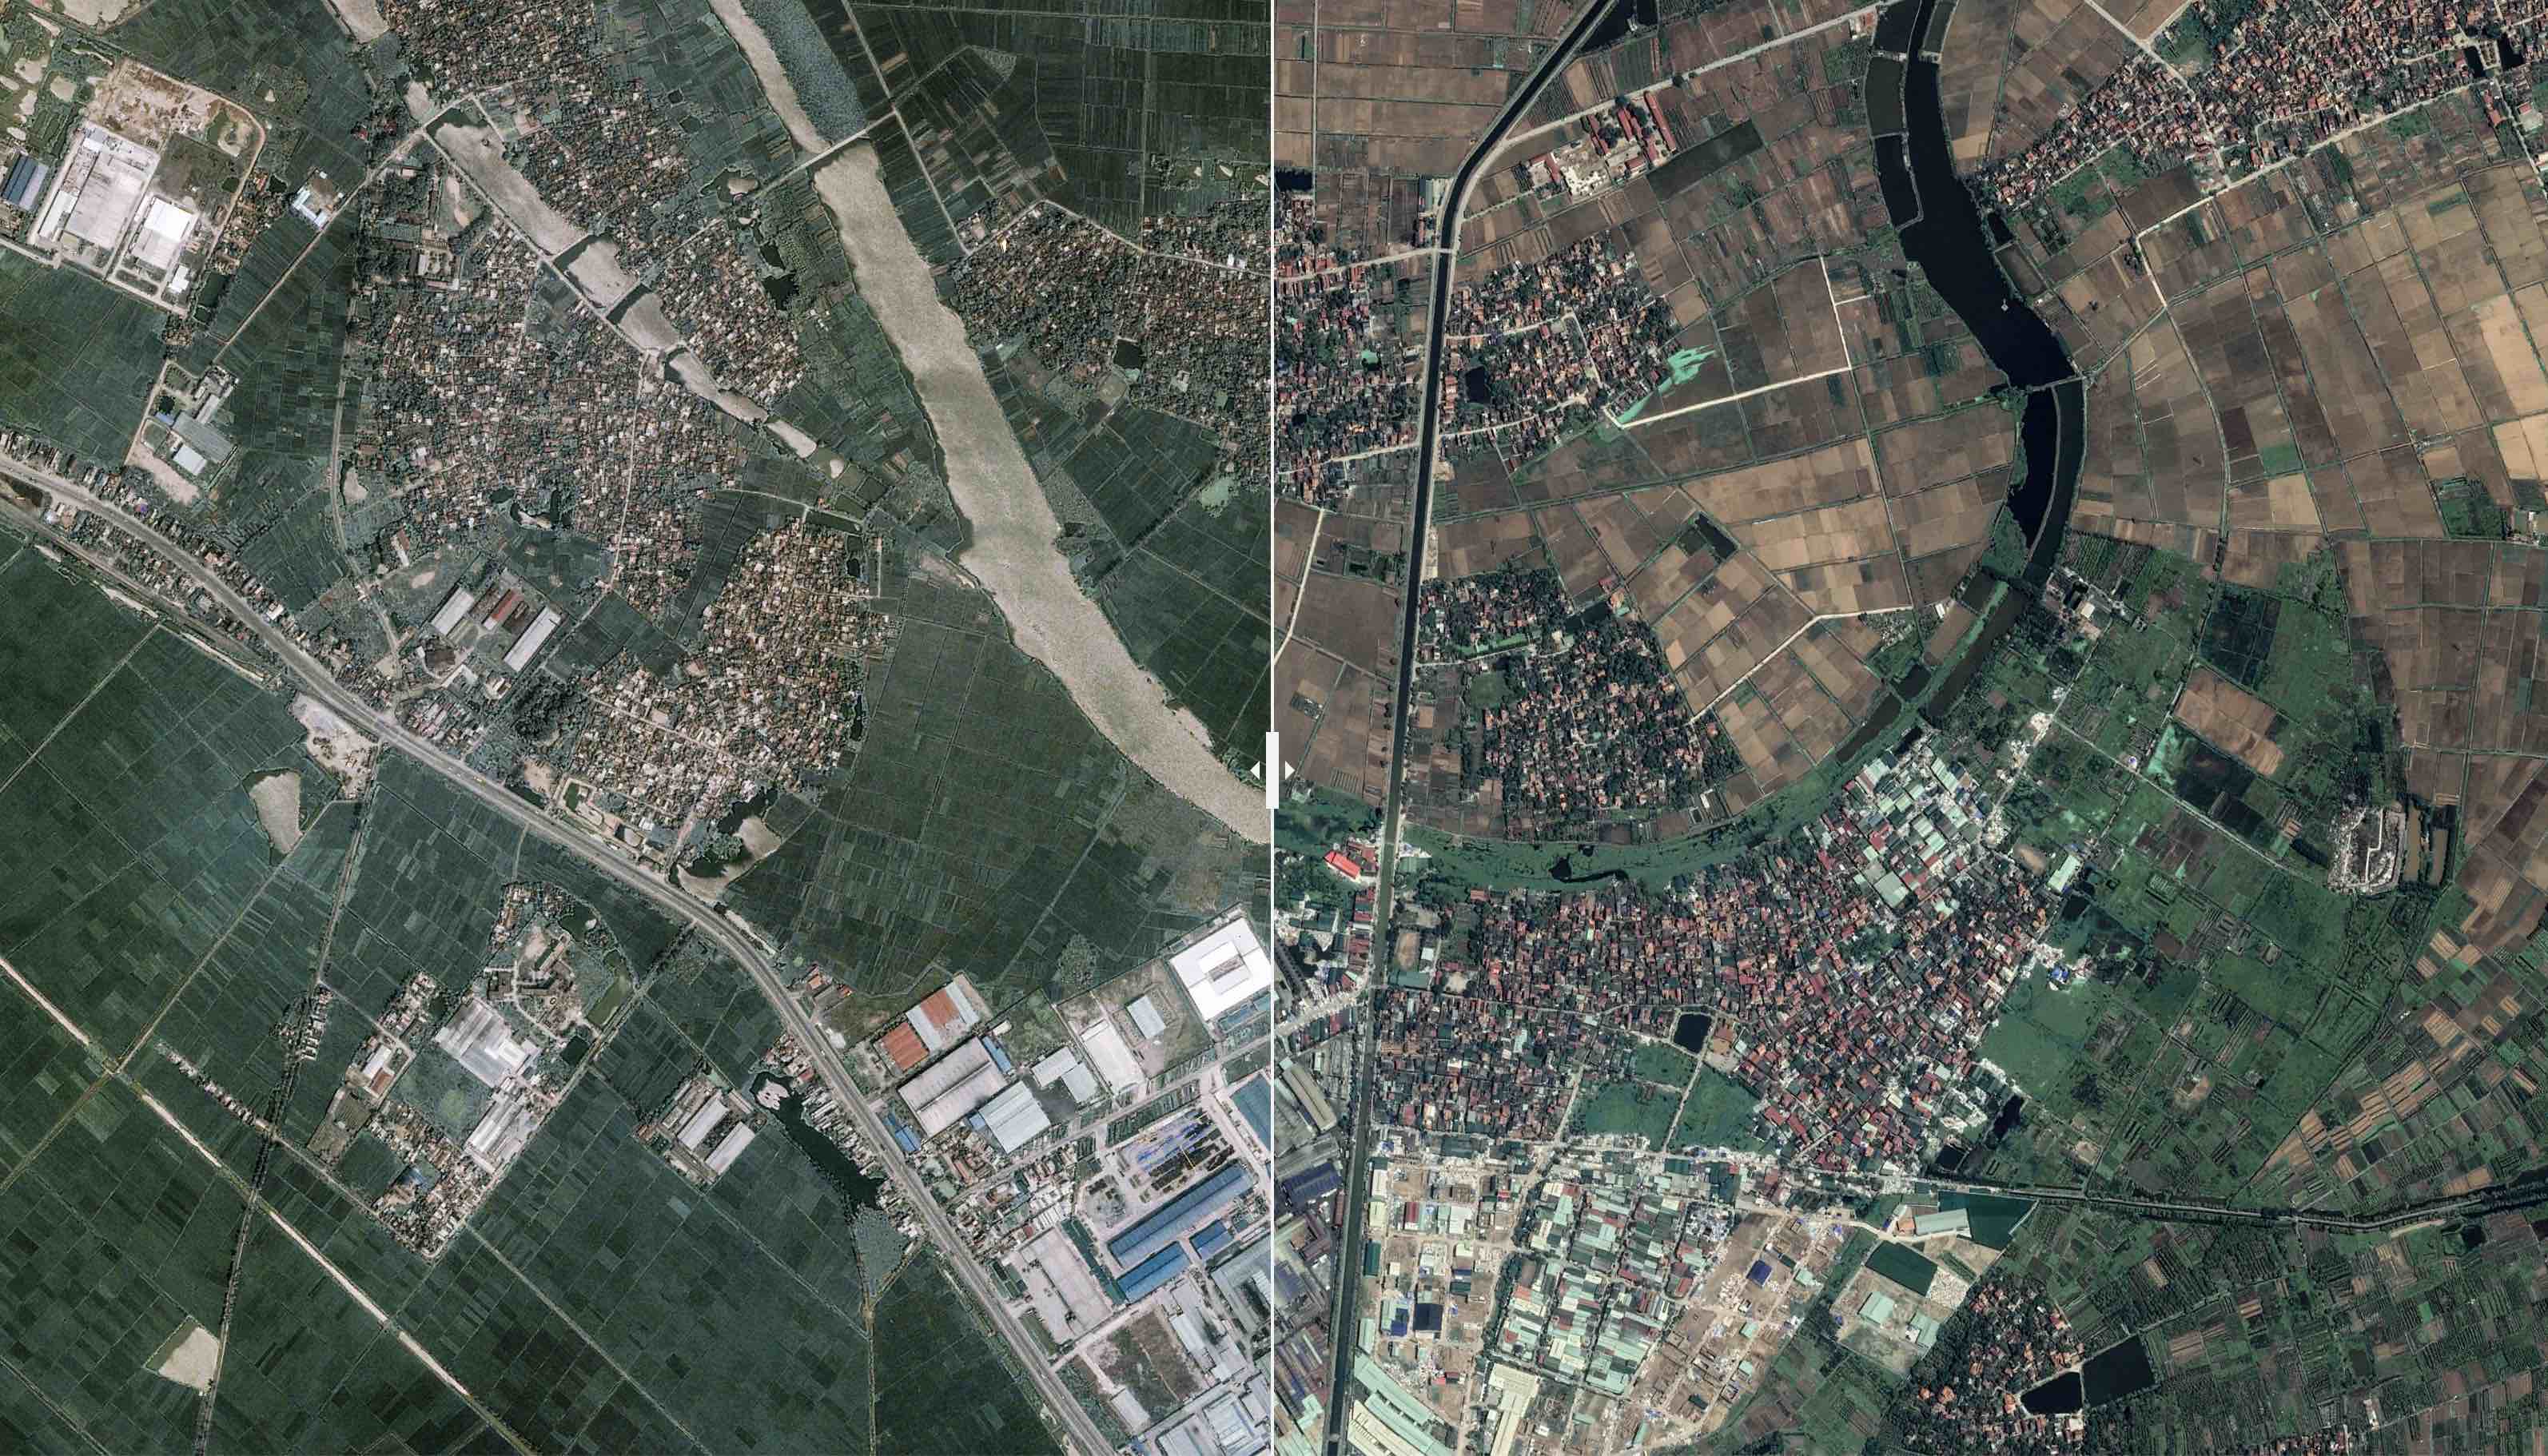
The Making of Vietnam's Plastic Village
Juxtaposing satellite images to demonstrate transformation of Minh Khai, a Vietnamese craft village built upon plastic recycling, and its surrounding area.
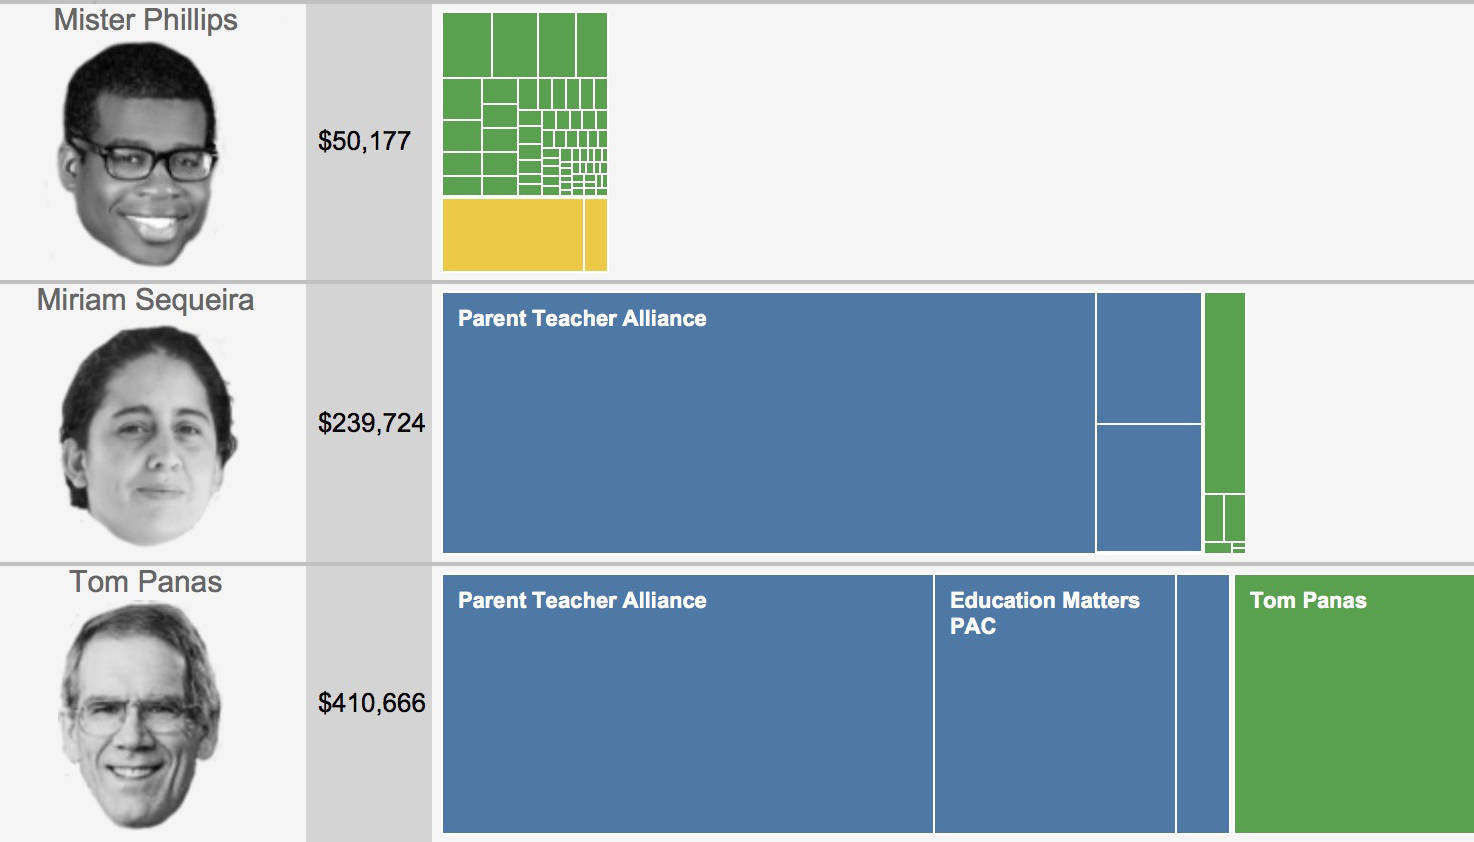
West Contra Costa school board races attract significant donations
A visual breakdown of significant campaign donations from organizations linked with charter schools that flooded two West Contra Costa school board races.
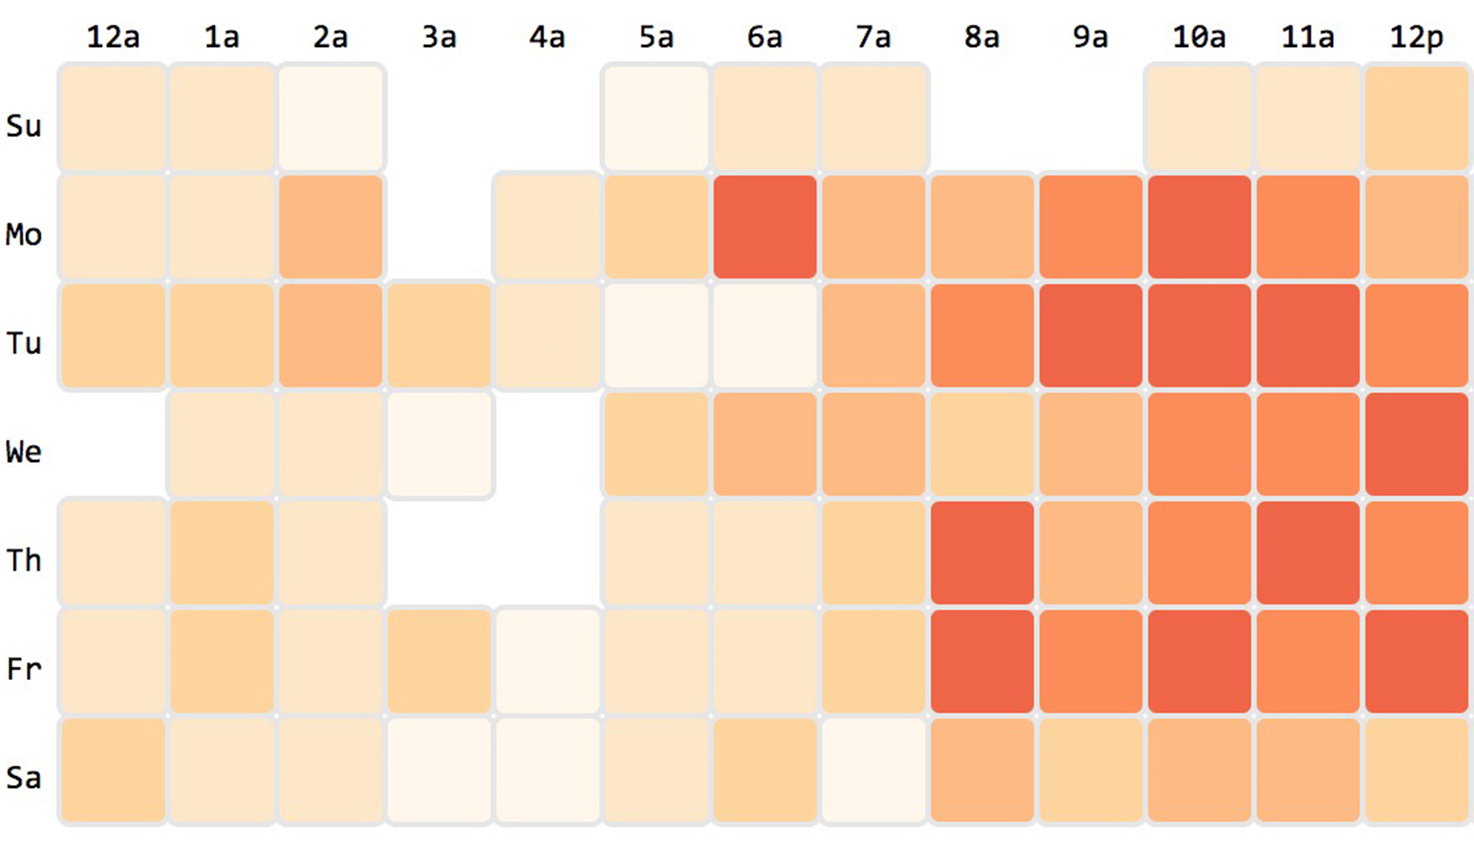
Fatal Mining Accidents Reported by Operators and Contractors
A calendar heatmap documenting fatalities reported by mine operators and contractors since 2000. Part of a graphics project detailing mine accidents across the country.
Mining Accidents within the U.S.
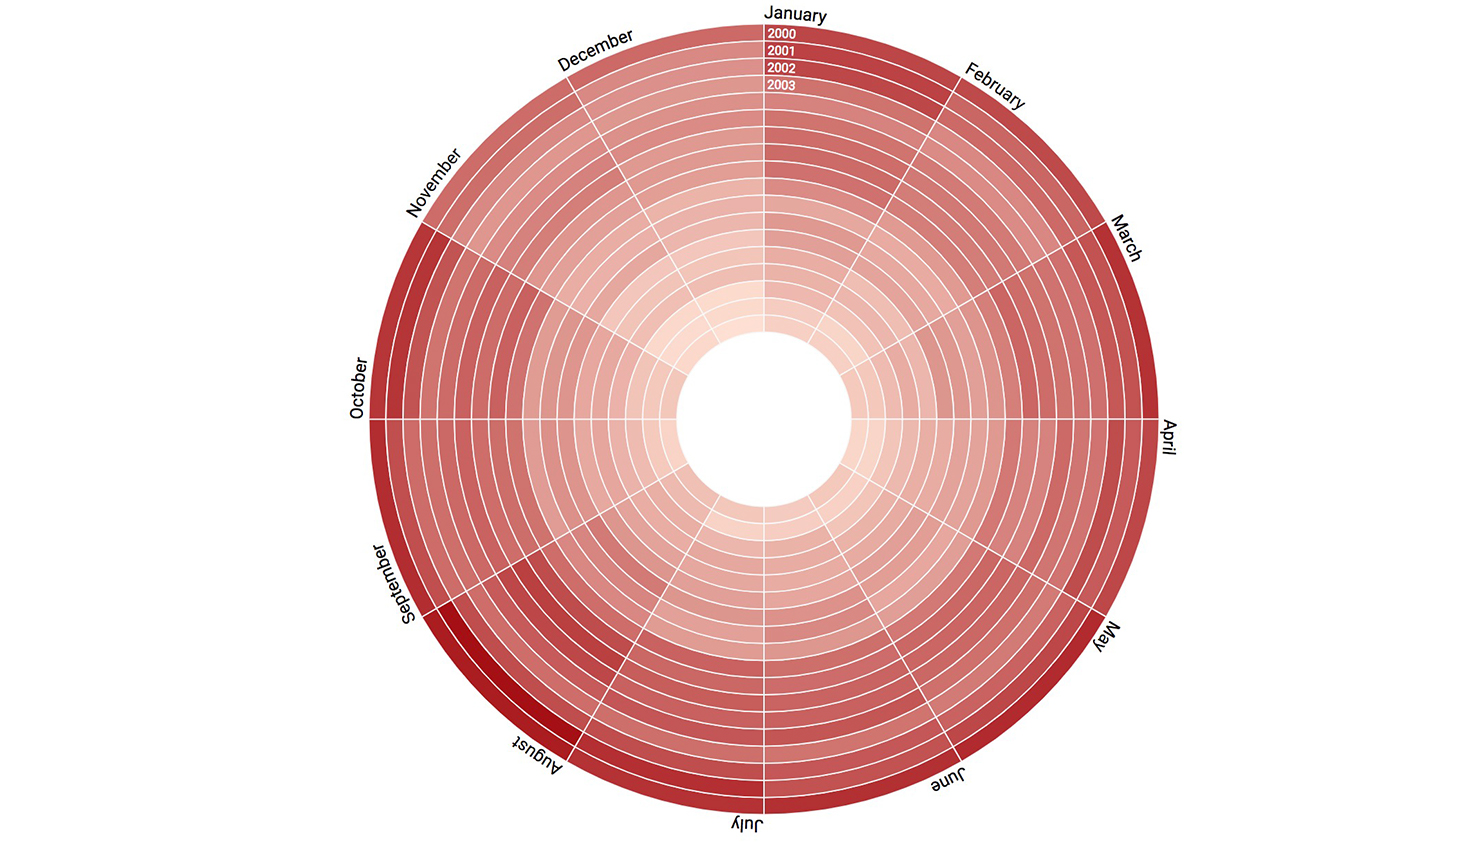
A circular heatmap showcasing how the number of mining accidents changed from 2000 to 2017 on a monthly basis. Part of a graphics project detailing mine accidents across the country.
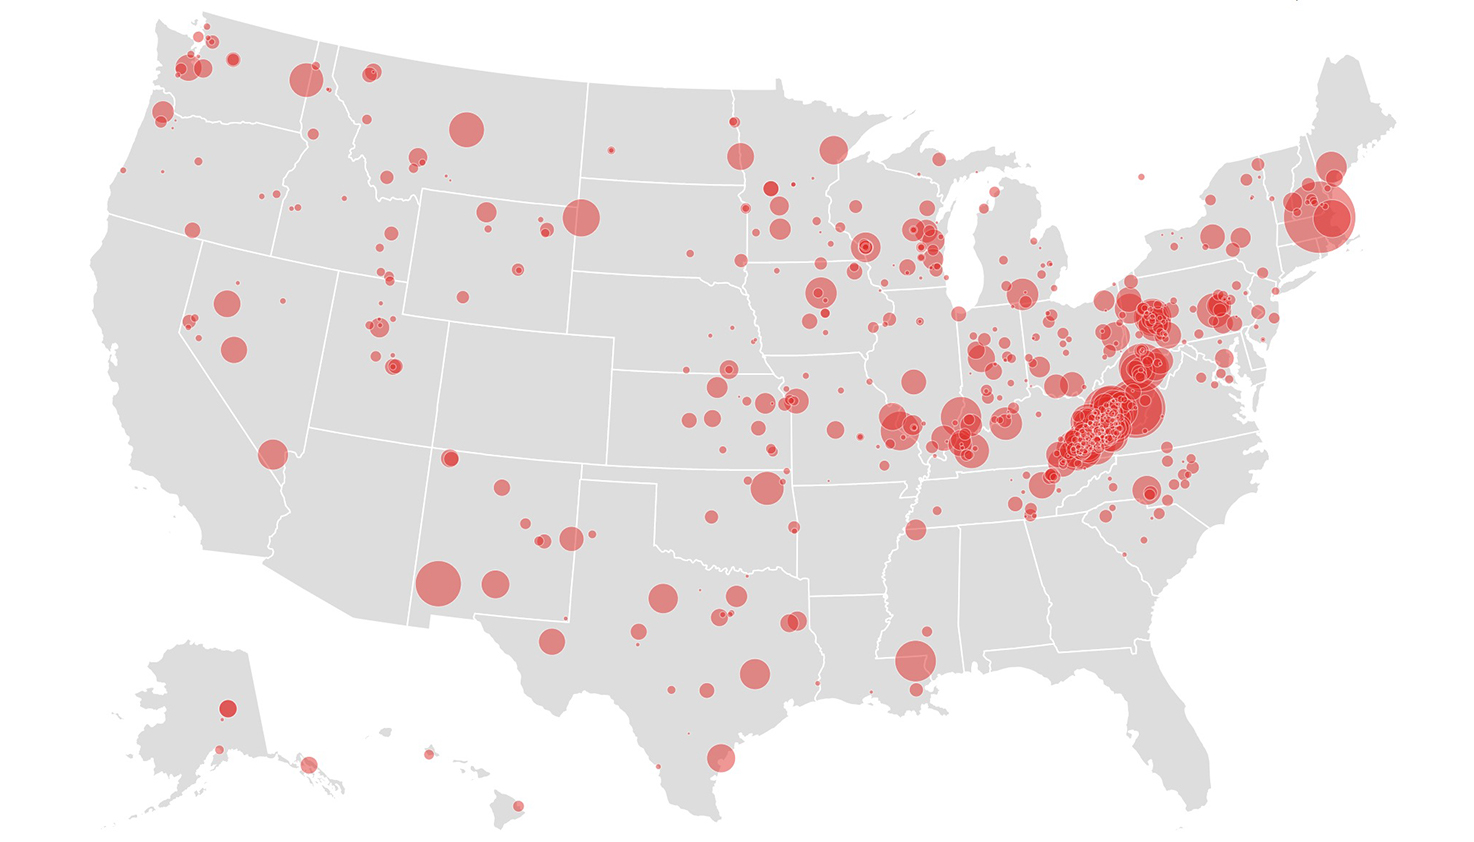
Are mines in the United States getting safer in the last 20 years?
A bubble map identifying mines with high accident rates in the United States from 2000 to 2017. Part of a graphics project detailing mine accidents across the country.